Share this
by Phoenix Energy Technologies on Sep 26, 2018

This post is part of The Guide to Building Management Technologies.
Enterprise building and facilities managers need to understand a lot of moving parts at a glance. Are buildings too warm or too cold? Are there hardware issues that need attention? Maybe it's time for maintenance. Unfortunately, even when the data is available, creating trends and understanding patterns tends to become a manual task, copying and pasting into spreadsheets.
But now, introduced September 26, 2018 at PRSM's Mid-Year Conference in Scottsdale, Arizona, facilities managers, energy managers, and C-suite leaders can get a "single pane of glass" view into their smart buildings.
For years, PhoenixET's proprietary gateways accessing many leading building control systems have allowed its customers to access data from multiple systems within Enterprise Data Xchange (EDX) applications such as Building View, Command Manager, Schedule Manager and more. But now, you can access the most relevant trends and visualizations all in one customizable view.
Executive Dashboard
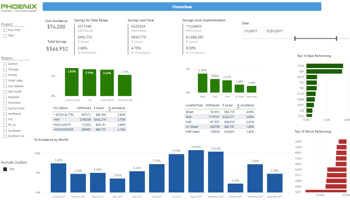
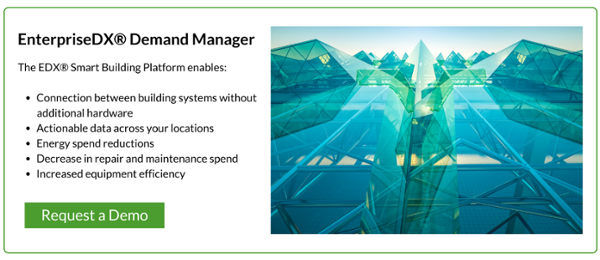
One of the most popular features, the Executive Dashboard will help facilities and energy managers communicate the status of their entire enterprise in an emailable executive dashboard. Reports include:
- Total Savings in kWh or dollars (you select the dates)
- Top 10 best and worst performing locations
- Cost avoidance, and more.
But it's not just visualizing a static dashboard. Select the locations, systems, or dates, or even request custom parameters that make sense for your business.
"Active" Reports
As if the ability to view all your building data from one place wasn't enough, the Building Intelligence Portal is integrated to the rest of the Enterprise Data Xchange platform, so if there are anomalies or issues, you can click through to address those issues on the spot, saving time, and money!
Interactive Map
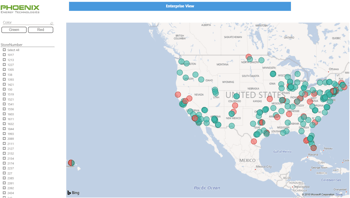 For facilities managers that have a large number of national or even global locations, understanding the whole ecosystem at a glance is very helpful. Using the interactive map feature, you can see all of your locations or equipment with a heatmap that drills down to multiple customizable data points.
There are many more features that can save your team significant time and manual tracking, and you can learn all about them here.