Building Intelligence
Building data is hard to gather and consolidate, because of legacy and proprietary building equipment. Energy and facilities teams rely on multiple data sources and manual consolidation to create trends and make decisions.You’ll get a real-time summary of energy and dollar savings, cost avoidance, and insight into your best and worst performing locations , all without the need for any time-consuming manual data manipulation tasks. While the real-time analytics engine continuously monitors progress towards your smart building goals!
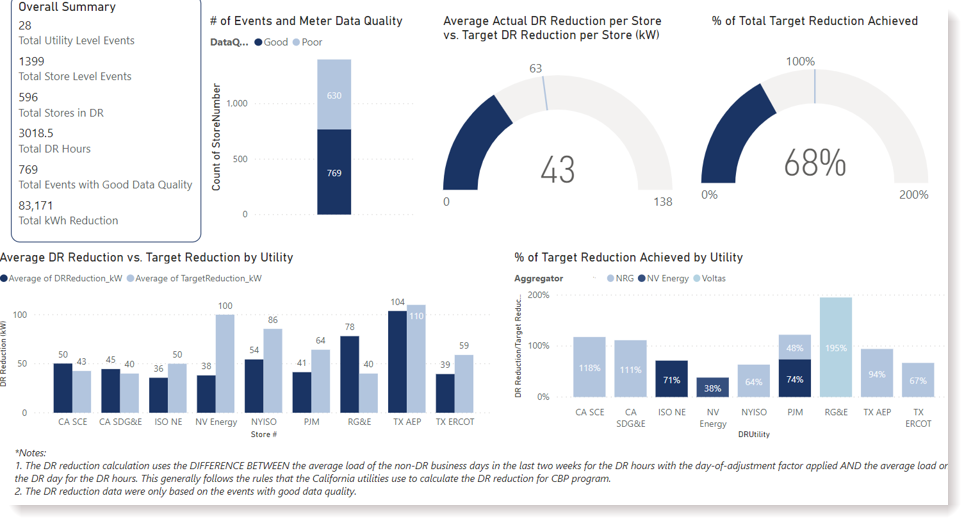
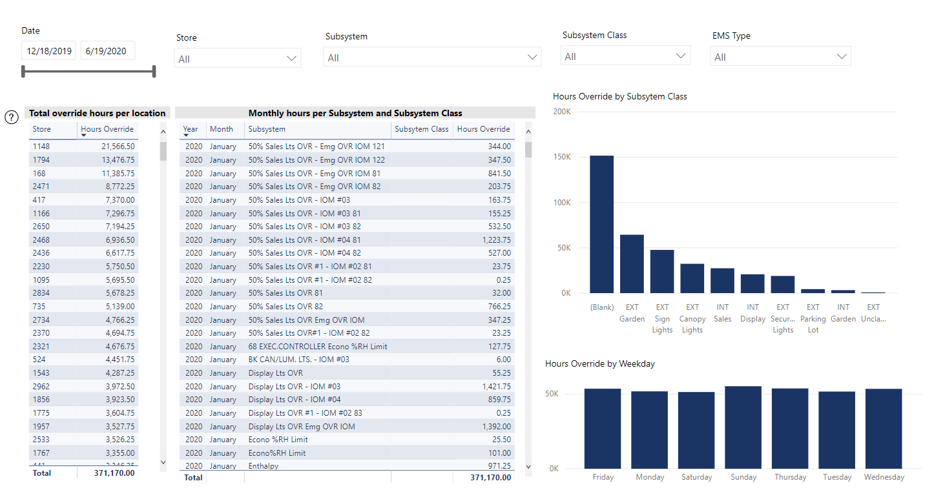
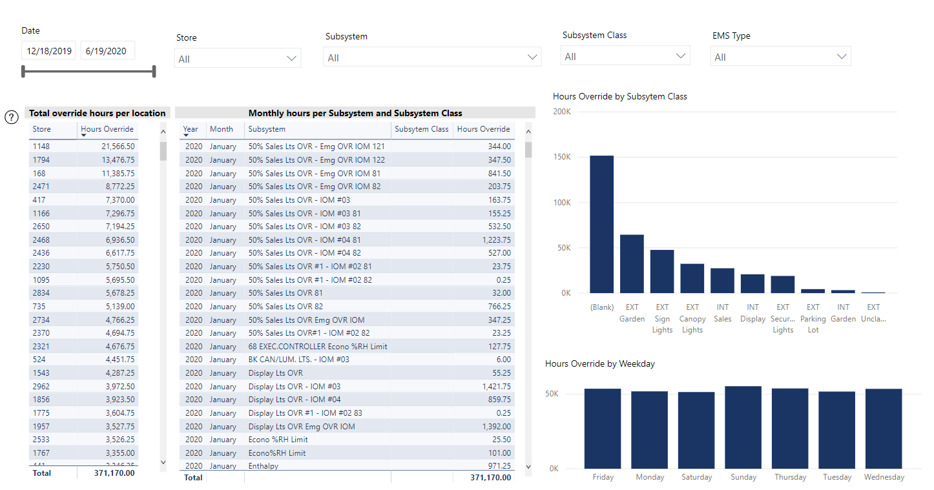
10 included pre-created charts and graphs created by PhoenixET's energy and facilities experts let you get your system health at a glance.
|
Executive Dashboard |
Zone Temp Setpoint Comparison |
|
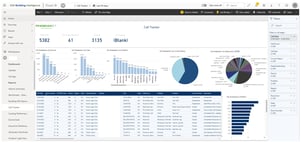
Call Tracker |
Building kW Demand |
|
Enterprise View |
Overrides |
|
EUI Ranking |
ECM reports |
|
Runtime Outliers |
Demand Management |
Active reportingAutomatically take corrective and proactive action based on data trends and anomalies. Data is updated on demand for some datasets |
|
Enterprise-wide building health at a glanceGet the current state of your energy usage, comfort and calls/alarms across all your control systems and connected machines in a normalized dashboard. No conversion or legends required. |
 |
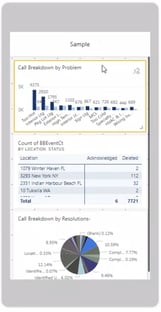
Mobile App for updates on the goUtilize the native mobile app, making the features of Building Intelligence easily available from any mobile device |
 |
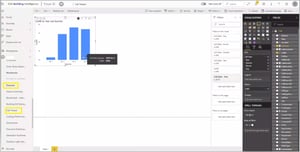
Ad hoc Report and Dashboard creation using the intuitive interfaceEasily filter and select data to create the view that meets your needs; by region, brand or other selection. Build dashboards using existing datasets to create a personalized view of the metrics important to you. |
 |
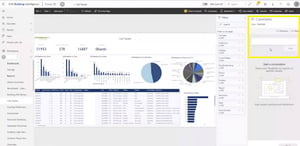
Collaboration toolsStart a conversation about your data and observations right in the dashboard. Manage users and teams. |
 |
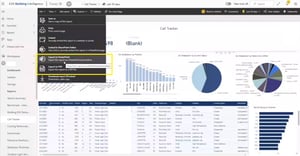
Export and AnalyzeWant to export your data and analyze in Excel or elsewhere? How about exporting your dashboards to PowerPoint for an executive briefing? No problem. |
 |


