EnterpriseDX® PLATFORM
Carbon Manager®
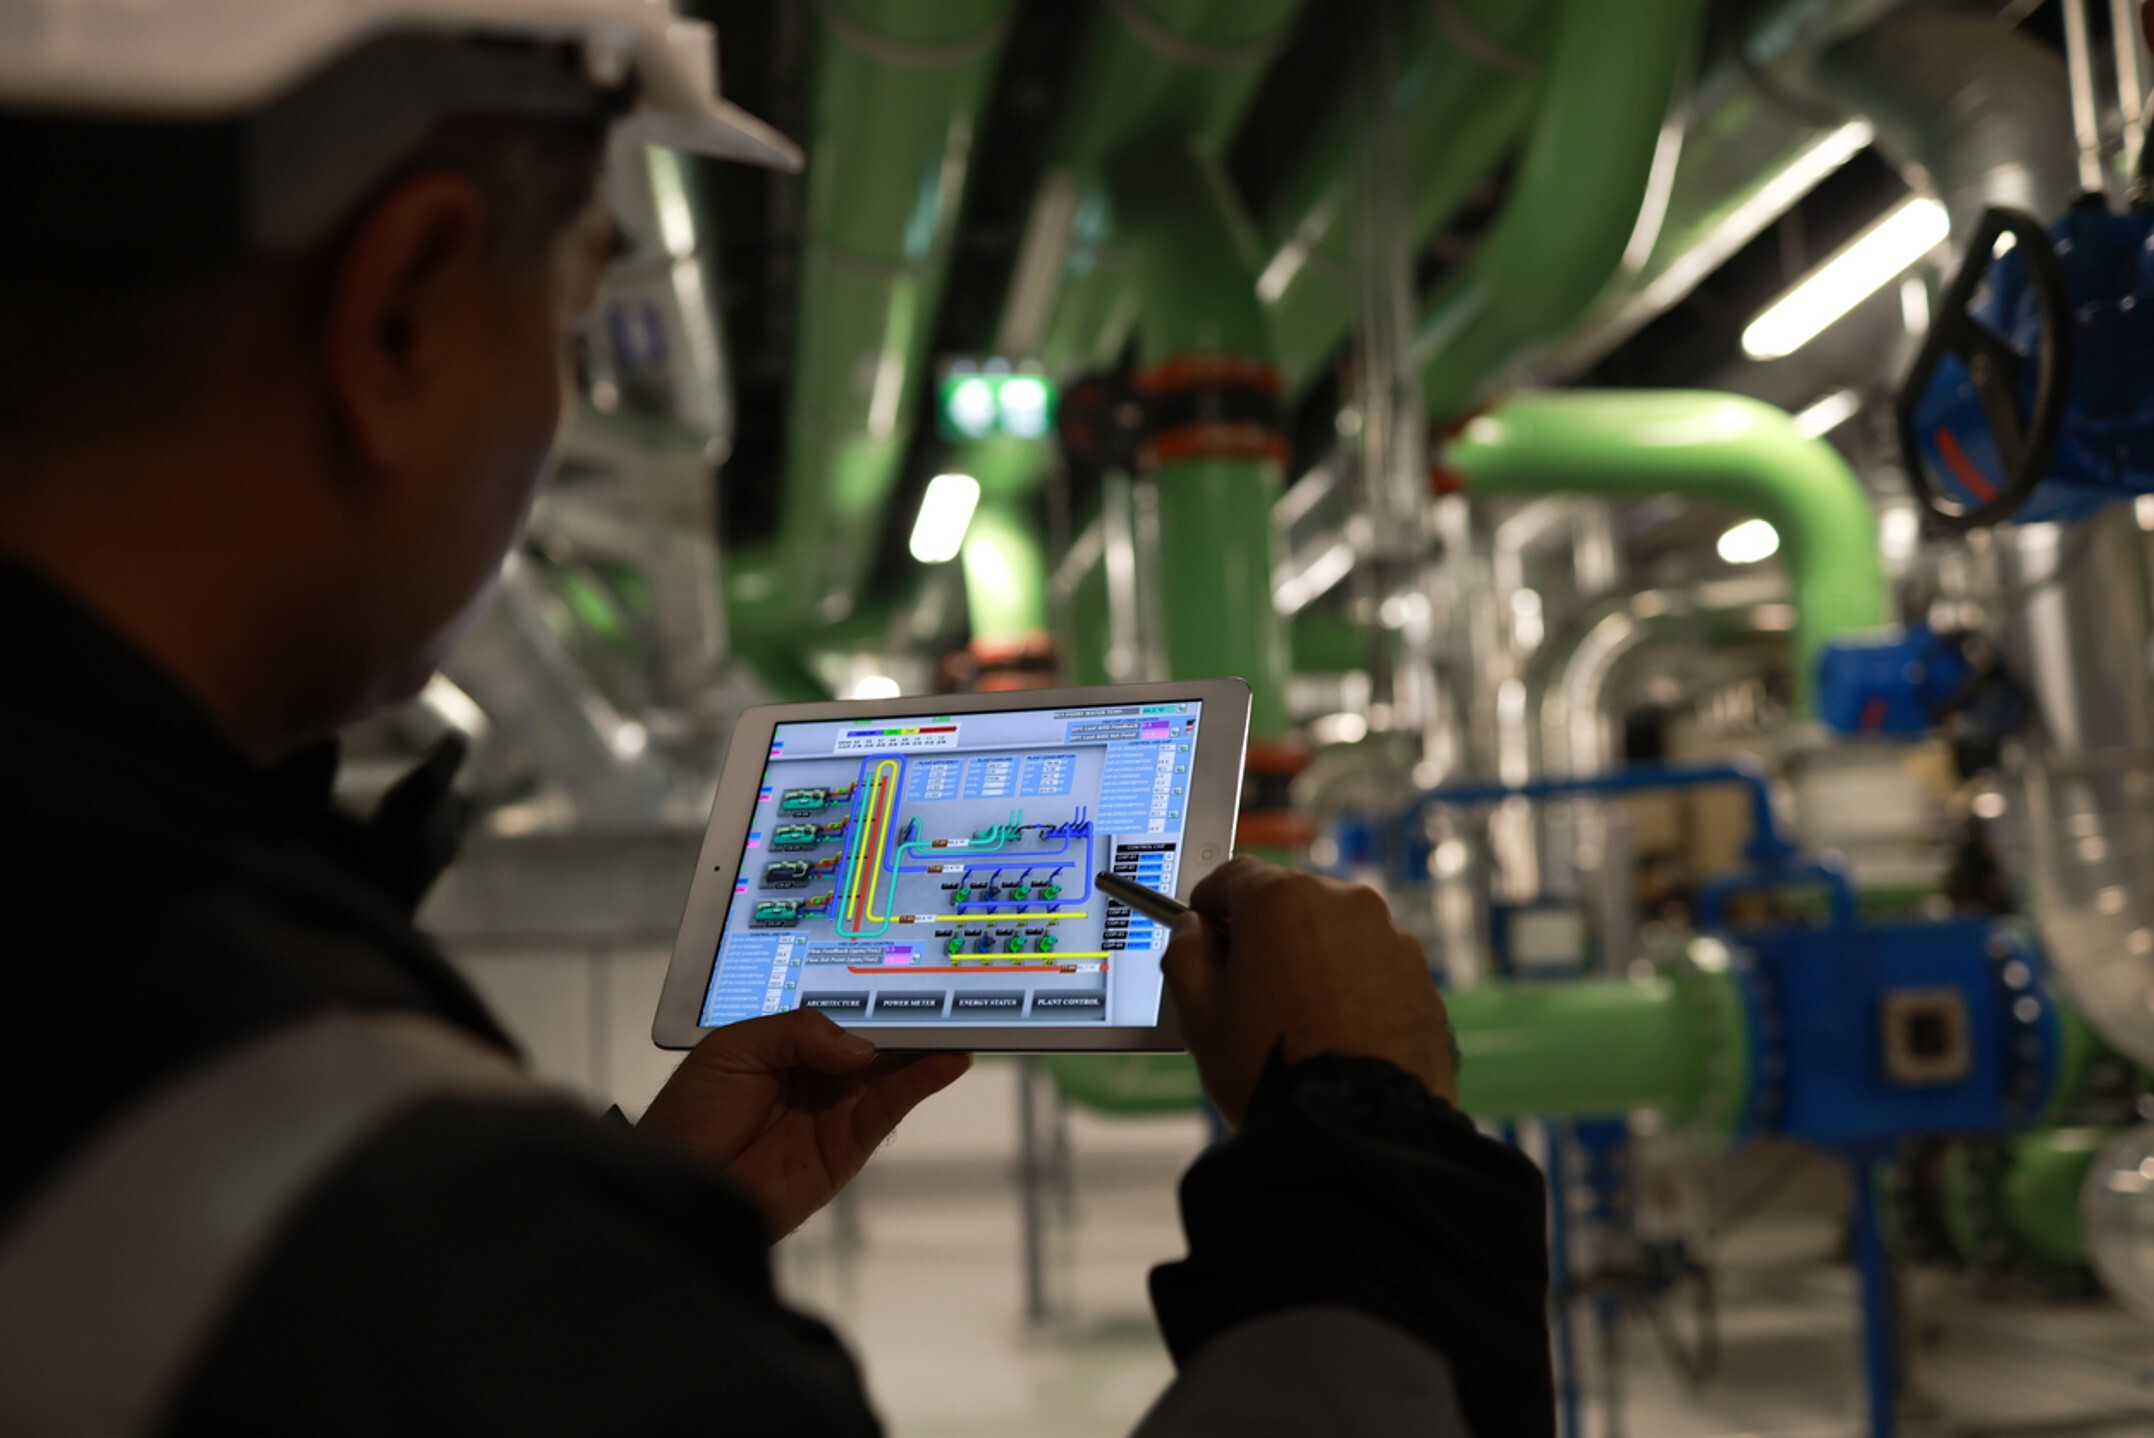
Carbon Manager® is a cloud-based, Smart Building application that makes it easy for enterprises to track and analyze carbon intensity from Scope 2 emissions sources.
It provides actionable measures to mitigate carbon impacts on businesses and the environment.


Track and report progress towards your corporate sustainability goals.
Efficiently quantify your carbon footprint. Measure, and report the impact of your efforts to reduce carbon across your portfolio without incurring capital costs.


Demonstrate your commitment to reduce your carbon footprint.
Track and report progress towards meeting your stated corporate sustainability goals.
Why Continuous Commissioning Is Essential for Multi-Site Commercial Buildings
Why Continuous Commissioning Is Essential for Multi-Site Commercial Buildings
Jan 27, 2026
7
min read
AIM Act Update: What the New EPA Proposal Means for Automatic Leak Detection (ALD)

AIM Act Update: What the New EPA Proposal Means for Automatic Leak Detection (ALD)
Dec 16, 2025
2
min read
Unlocking Hidden Revenue: How Facilities Teams Can Win With Demand Response in 2026
Unlocking Hidden Revenue: How Facilities Teams Can Win With Demand Response in 2026
Nov 24, 2025
4
min read